これはインタラクティブなノートブックです。ローカルで実行するか、以下のリンクを利用してください:
マルチエージェントシステムにおける構造化出力
strict: true を使用することで、応答が与えられたスキーマに従うことを保証できます。
マルチエージェントシステムで構造化出力を使用すると、エージェント間で一貫性があり処理しやすいデータを確保できるため、コミュニケーションが向上します。また、明示的な拒否を可能にすることで安全性が高まり、再試行や検証の必要がなくなることでパフォーマンスも向上します。これにより、インタラクションが簡素化され、システム全体の効率が高まります。
このチュートリアルでは、マルチエージェントシステムで構造化出力を活用し、それらを Weave でトレースする方法を説明します。
出典: このクックブックは、OpenAI の Structured Outputs のサンプルコード をベースにしており、Weave を用いた可視化を改善するためにいくつかの変更を加えています。
依存関係のインストール
不正なコードを報告
コピー
AIに質問
!pip install -qU openai weave wandb
python
%%capture
# openai のバグを修正するための一時的な回避策:
# TypeError: Client.__init__() got an unexpected keyword argument 'proxies'
# 参照: https://community.openai.com/t/error-with-openai-1-56-0-client-init-got-an-unexpected-keyword-argument-proxies/1040332/15
!pip install "httpx<0.28"
WANDB_API_KEY を環境変数に設定しておくことで、wandb.login() で簡単にログインできるようにします(これは Colab にはシークレットとして渡す必要があります)。
W&B でログを記録したいプロジェクトを name_of_wandb_project に設定します。
NOTE: name_of_wandb_project は、トレースを記録するチームを指定する場合、{team_name}/{project_name} という形式にすることもできます。
その後、weave.init() を呼び出して Weave クライアントを取得します。
OpenAI API を使用するので、OpenAI の APIキー も必要です。OpenAI プラットフォーム上でサインアップすることで、自分の APIキー を取得できます(これも Colab にはシークレットとして渡す必要があります)。
不正なコードを報告
コピー
AIに質問
import base64
import json
import os
from io import BytesIO, StringIO

import matplotlib.pyplot as plt
import numpy as np
import pandas as pd
import wandb
from google.colab import userdata
from openai import OpenAI

import weave
python
os.environ["WANDB_API_KEY"] = userdata.get("WANDB_API_KEY")
os.environ["OPENAI_API_KEY"] = userdata.get("OPENAI_API_KEY")

wandb.login()
name_of_wandb_project = "multi-agent-structured-output"
weave.init(name_of_wandb_project)

client = OpenAI()
MODEL = "gpt-4o-2024-08-06"
エージェントのセットアップ
- トリアージエージェント: どのエージェントを呼び出すかを決定する
- データ前処理エージェント: たとえばデータのクリーニングなどを行って、分析用にデータを準備する
- データ分析エージェント: データの分析を実行する
- Data Visualization エージェント: 分析結果を可視化してインサイトを抽出する まずは、これら各エージェントに対するシステムプロンプトを定義します。
不正なコードを報告
コピー
AIに質問
triaging_system_prompt = """You are a Triaging Agent. Your role is to assess the user's query and route it to the relevant agents. The agents available are:
- Data Processing Agent: Cleans, transforms, and aggregates data.
- Analysis Agent: Performs statistical, correlation, and regression analysis.
- Visualization Agent: Creates bar charts, line charts, and pie charts.

Use the send_query_to_agents tool to forward the user's query to the relevant agents. Also, use the speak_to_user tool to get more information from the user if needed."""

processing_system_prompt = """You are a Data Processing Agent. Your role is to clean, transform, and aggregate data using the following tools:
- clean_data
- transform_data
- aggregate_data"""

analysis_system_prompt = """You are an Analysis Agent. Your role is to perform statistical, correlation, and regression analysis using the following tools:
- stat_analysis
- correlation_analysis
- regression_analysis"""

visualization_system_prompt = """You are a Visualization Agent. Your role is to create bar charts, line charts, and pie charts using the following tools:
- create_bar_chart
- create_line_chart
- create_pie_chart"""
不正なコードを報告
コピー
AIに質問
triage_tools = [
    {
        "type": "function",
        "function": {
            "name": "send_query_to_agents",
            "description": "ユーザーのクエリを、エージェントの能力に基づいて関連するエージェントに送信します。",
            "parameters": {
                "type": "object",
                "properties": {
                    "agents": {
                        "type": "array",
                        "items": {"type": "string"},
                        "description": "クエリの送信先となるエージェント名の配列。",
                    },
                    "query": {
                        "type": "string",
                        "description": "送信するユーザークエリ。",
                    },
                },
                "required": ["agents", "query"],
            },
        },
        "strict": True,
    }
]

preprocess_tools = [
    {
        "type": "function",
        "function": {
            "name": "clean_data",
            "description": "重複の削除と欠損値の処理により、提供されたデータをクリーニングします。",
            "parameters": {
                "type": "object",
                "properties": {
                    "data": {
                        "type": "string",
                        "description": "クリーニング対象のデータセット。JSON や CSV などの適切な形式である必要があります。",
                    }
                },
                "required": ["data"],
                "additionalProperties": False,
            },
        },
        "strict": True,
    },
    {
        "type": "function",
        "function": {
            "name": "transform_data",
            "description": "指定されたルールに基づいてデータを変換します。",
            "parameters": {
                "type": "object",
                "properties": {
                    "data": {
                        "type": "string",
                        "description": "変換対象のデータ。JSON や CSV などの適切な形式である必要があります。",
                    },
                    "rules": {
                        "type": "string",
                        "description": "構造化された形式で指定された、適用する変換ルール。",
                    },
                },
                "required": ["data", "rules"],
                "additionalProperties": False,
            },
        },
        "strict": True,
    },
    {
        "type": "function",
        "function": {
            "name": "aggregate_data",
            "description": "指定された列と操作によってデータを集計します。",
            "parameters": {
                "type": "object",
                "properties": {
                    "data": {
                        "type": "string",
                        "description": "集計対象のデータ。JSON や CSV などの適切な形式である必要があります。",
                    },
                    "group_by": {
                        "type": "array",
                        "items": {"type": "string"},
                        "description": "グループ化する列。",
                    },
                    "operations": {
                        "type": "string",
                        "description": "構造化された形式で指定された、実行する集計操作。",
                    },
                },
                "required": ["data", "group_by", "operations"],
                "additionalProperties": False,
            },
        },
        "strict": True,
    },
]

analysis_tools = [
    {
        "type": "function",
        "function": {
            "name": "stat_analysis",
            "description": "指定されたデータセットに対して統計分析を実行します。",
            "parameters": {
                "type": "object",
                "properties": {
                    "data": {
                        "type": "string",
                        "description": "分析対象のデータセット。JSON や CSV などの適切な形式である必要があります。",
                    }
                },
                "required": ["data"],
                "additionalProperties": False,
            },
        },
        "strict": True,
    },
    {
        "type": "function",
        "function": {
            "name": "correlation_analysis",
            "description": "データセット内の変数間の相関係数を計算します。",
            "parameters": {
                "type": "object",
                "properties": {
                    "data": {
                        "type": "string",
                        "description": "分析対象のデータセット。JSON や CSV などの適切な形式である必要があります。",
                    },
                    "variables": {
                        "type": "array",
                        "items": {"type": "string"},
                        "description": "相関を計算する変数のリスト。",
                    },
                },
                "required": ["data", "variables"],
                "additionalProperties": False,
            },
        },
        "strict": True,
    },
    {
        "type": "function",
        "function": {
            "name": "regression_analysis",
            "description": "データセットに対して回帰分析を実行します。",
            "parameters": {
                "type": "object",
                "properties": {
                    "data": {
                        "type": "string",
                        "description": "分析対象のデータセット。JSON や CSV などの適切な形式である必要があります。",
                    },
                    "dependent_var": {
                        "type": "string",
                        "description": "回帰の目的変数。",
                    },
                    "independent_vars": {
                        "type": "array",
                        "items": {"type": "string"},
                        "description": "説明変数のリスト。",
                    },
                },
                "required": ["data", "dependent_var", "independent_vars"],
                "additionalProperties": False,
            },
        },
        "strict": True,
    },
]

visualization_tools = [
    {
        "type": "function",
        "function": {
            "name": "create_bar_chart",
            "description": "提供されたデータから棒グラフを作成します。",
            "parameters": {
                "type": "object",
                "properties": {
                    "data": {
                        "type": "string",
                        "description": "棒グラフ用のデータ。JSON や CSV などの適切な形式である必要があります。",
                    },
                    "x": {"type": "string", "description": "x 軸の列。"},
                    "y": {"type": "string", "description": "y 軸の列。"},
                },
                "required": ["data", "x", "y"],
                "additionalProperties": False,
            },
        },
        "strict": True,
    },
    {
        "type": "function",
        "function": {
            "name": "create_line_chart",
            "description": "提供されたデータから折れ線グラフを作成します。",
            "parameters": {
                "type": "object",
                "properties": {
                    "data": {
                        "type": "string",
                        "description": "折れ線グラフ用のデータ。JSON や CSV などの適切な形式である必要があります。",
                    },
                    "x": {"type": "string", "description": "x 軸の列。"},
                    "y": {"type": "string", "description": "y 軸の列。"},
                },
                "required": ["data", "x", "y"],
                "additionalProperties": False,
            },
        },
        "strict": True,
    },
    {
        "type": "function",
        "function": {
            "name": "create_pie_chart",
            "description": "提供されたデータから円グラフを作成します。",
            "parameters": {
                "type": "object",
                "properties": {
                    "data": {
                        "type": "string",
                        "description": "円グラフ用のデータ。JSON や CSV などの適切な形式である必要があります。",
                    },
                    "labels": {
                        "type": "string",
                        "description": "ラベルの列。",
                    },
                    "values": {
                        "type": "string",
                        "description": "値の列。",
                    },
                },
                "required": ["data", "labels", "values"],
                "additionalProperties": False,
            },
        },
        "strict": True,
    },
]
Weave を使用してマルチエージェントのトラッキングを有効にする
- ユーザーからのクエリをマルチエージェントシステムに渡す処理
- マルチエージェントシステムの内部動作を扱う処理
- ツール呼び出しを実行する処理
不正なコードを報告
コピー
AIに質問
# クエリの例

user_query = """
Below is some data. I want you to first remove the duplicates then analyze the statistics of the data as well as plot a line chart.

house_size (m3), house_price ($)
90, 100
80, 90
100, 120
90, 100
"""
clean_data、start_analysis、use_line_chart だと推測できます。
まず、ツール呼び出しの実行を担う関数を定義します。
Python 関数に @weave.op() を付与することで、言語モデルの入力・出力・トレースをログに記録し、デバッグできます。
マルチエージェントシステムを作成する際には多くの関数が出てきますが、それらの関数の定義の上に @weave.op() を追加するだけで十分です。
不正なコードを報告
コピー
AIに質問
@weave.op()
def clean_data(data):
    data_io = StringIO(data)
    df = pd.read_csv(data_io, sep=",")
    df_deduplicated = df.drop_duplicates()
    return df_deduplicated

@weave.op()
def stat_analysis(data):
    data_io = StringIO(data)
    df = pd.read_csv(data_io, sep=",")
    return df.describe()

@weave.op()
def plot_line_chart(data):
    data_io = StringIO(data)
    df = pd.read_csv(data_io, sep=",")

    x = df.iloc[:, 0]
    y = df.iloc[:, 1]

    coefficients = np.polyfit(x, y, 1)
    polynomial = np.poly1d(coefficients)
    y_fit = polynomial(x)

    plt.figure(figsize=(10, 6))
    plt.plot(x, y, "o", label="Data Points")
    plt.plot(x, y_fit, "-", label="Best Fit Line")
    plt.title("Line Chart with Best Fit Line")
    plt.xlabel(df.columns[0])
    plt.ylabel(df.columns[1])
    plt.legend()
    plt.grid(True)

    # 表示前にプロットをBytesIOバッファに保存する
    buf = BytesIO()
    plt.savefig(buf, format="png")
    buf.seek(0)

    # プロットを表示する
    plt.show()

    # データURLのために画像をbase64エンコードする
    image_data = buf.getvalue()
    base64_encoded_data = base64.b64encode(image_data)
    base64_string = base64_encoded_data.decode("utf-8")
    data_url = f"data:image/png;base64,{base64_string}"

    return data_url

# ツールを実行する関数を定義する
@weave.op()
def execute_tool(tool_calls, messages):
    for tool_call in tool_calls:
        tool_name = tool_call.function.name
        tool_arguments = json.loads(tool_call.function.arguments)

        if tool_name == "clean_data":
            # データクリーニングをシミュレートする
            cleaned_df = clean_data(tool_arguments["data"])
            cleaned_data = {"cleaned_data": cleaned_df.to_dict()}
            messages.append(
                {"role": "tool", "name": tool_name, "content": json.dumps(cleaned_data)}
            )
            print("Cleaned data: ", cleaned_df)
        elif tool_name == "transform_data":
            # データ変換をシミュレートする
            transformed_data = {"transformed_data": "sample_transformed_data"}
            messages.append(
                {
                    "role": "tool",
                    "name": tool_name,
                    "content": json.dumps(transformed_data),
                }
            )
        elif tool_name == "aggregate_data":
            # データ集計をシミュレートする
            aggregated_data = {"aggregated_data": "sample_aggregated_data"}
            messages.append(
                {
                    "role": "tool",
                    "name": tool_name,
                    "content": json.dumps(aggregated_data),
                }
            )
        elif tool_name == "stat_analysis":
            # 統計分析をシミュレートする
            stats_df = stat_analysis(tool_arguments["data"])
            stats = {"stats": stats_df.to_dict()}
            messages.append(
                {"role": "tool", "name": tool_name, "content": json.dumps(stats)}
            )
            print("Statistical Analysis: ", stats_df)
        elif tool_name == "correlation_analysis":
            # 相関分析をシミュレートする
            correlations = {"correlations": "sample_correlations"}
            messages.append(
                {"role": "tool", "name": tool_name, "content": json.dumps(correlations)}
            )
        elif tool_name == "regression_analysis":
            # 回帰分析をシミュレートする
            regression_results = {"regression_results": "sample_regression_results"}
            messages.append(
                {
                    "role": "tool",
                    "name": tool_name,
                    "content": json.dumps(regression_results),
                }
            )
        elif tool_name == "create_bar_chart":
            # 棒グラフの作成をシミュレートする
            bar_chart = {"bar_chart": "sample_bar_chart"}
            messages.append(
                {"role": "tool", "name": tool_name, "content": json.dumps(bar_chart)}
            )
        elif tool_name == "create_line_chart":
            # 折れ線グラフの作成をシミュレートする
            line_chart = {"line_chart": plot_line_chart(tool_arguments["data"])}
            messages.append(
                {"role": "tool", "name": tool_name, "content": json.dumps(line_chart)}
            )
        elif tool_name == "create_pie_chart":
            # 円グラフの作成をシミュレートする
            pie_chart = {"pie_chart": "sample_pie_chart"}
            messages.append(
                {"role": "tool", "name": tool_name, "content": json.dumps(pie_chart)}
            )
    return messages
不正なコードを報告
コピー
AIに質問
# 各エージェントの処理を担当する関数を定義する
@weave.op()
def handle_data_processing_agent(query, conversation_messages):
    messages = [{"role": "system", "content": processing_system_prompt}]
    messages.append({"role": "user", "content": query})

    response = client.chat.completions.create(
        model=MODEL,
        messages=messages,
        temperature=0,
        tools=preprocess_tools,
    )

    conversation_messages.append(
        [tool_call.function for tool_call in response.choices[0].message.tool_calls]
    )
    execute_tool(response.choices[0].message.tool_calls, conversation_messages)

@weave.op()
def handle_analysis_agent(query, conversation_messages):
    messages = [{"role": "system", "content": analysis_system_prompt}]
    messages.append({"role": "user", "content": query})

    response = client.chat.completions.create(
        model=MODEL,
        messages=messages,
        temperature=0,
        tools=analysis_tools,
    )

    conversation_messages.append(
        [tool_call.function for tool_call in response.choices[0].message.tool_calls]
    )
    execute_tool(response.choices[0].message.tool_calls, conversation_messages)

@weave.op()
def handle_visualization_agent(query, conversation_messages):
    messages = [{"role": "system", "content": visualization_system_prompt}]
    messages.append({"role": "user", "content": query})

    response = client.chat.completions.create(
        model=MODEL,
        messages=messages,
        temperature=0,
        tools=visualization_tools,
    )

    conversation_messages.append(
        [tool_call.function for tool_call in response.choices[0].message.tool_calls]
    )
    execute_tool(response.choices[0].message.tool_calls, conversation_messages)
不正なコードを報告
コピー
AIに質問
# ユーザー入力とトリアージを処理する関数
@weave.op()
def handle_user_message(user_query, conversation_messages=None):
    if conversation_messages is None:
        conversation_messages = []
    user_message = {"role": "user", "content": user_query}
    conversation_messages.append(user_message)

    messages = [{"role": "system", "content": triaging_system_prompt}]
    messages.extend(conversation_messages)

    response = client.chat.completions.create(
        model=MODEL,
        messages=messages,
        temperature=0,
        tools=triage_tools,
    )

    conversation_messages.append(
        [tool_call.function for tool_call in response.choices[0].message.tool_calls]
    )

    for tool_call in response.choices[0].message.tool_calls:
        if tool_call.function.name == "send_query_to_agents":
            agents = json.loads(tool_call.function.arguments)["agents"]
            query = json.loads(tool_call.function.arguments)["query"]
            for agent in agents:
                if agent == "Data Processing Agent":
                    handle_data_processing_agent(query, conversation_messages)
                elif agent == "Analysis Agent":
                    handle_analysis_agent(query, conversation_messages)
                elif agent == "Visualization Agent":
                    handle_visualization_agent(query, conversation_messages)

    outputs = extract_tool_contents(conversation_messages)

    return outputs

functions = [
    "clean_data",
    "transform_data",
    "stat_analysis",
    "aggregate_data",
    "correlation_analysis",
    "regression_analysis",
    "create_bar_chart",
    "create_line_chart",
    "create_pie_chart",
]

@weave.op()
def extract_tool_contents(data):
    contents = {}
    contents["all"] = data
    for element in data:
        if (
            isinstance(element, dict)
            and element.get("role") == "tool"
            and element.get("name") in functions
        ):
            name = element["name"]
            content_str = element["content"]
            try:
                content_json = json.loads(content_str)
                if "chart" not in element.get("name"):
                    contents[name] = [content_json]
                else:
                    first_key = next(iter(content_json))
                    second_level = content_json[first_key]
                    if isinstance(second_level, dict):
                        second_key = next(iter(second_level))
                        contents[name] = second_level[second_key]
                    else:
                        contents[name] = second_level
            except json.JSONDecodeError:
                print(f"{name} の JSON デコードエラー")
                contents[name] = None

    return contents
Weave でマルチエージェントシステムを実行し、可視化する
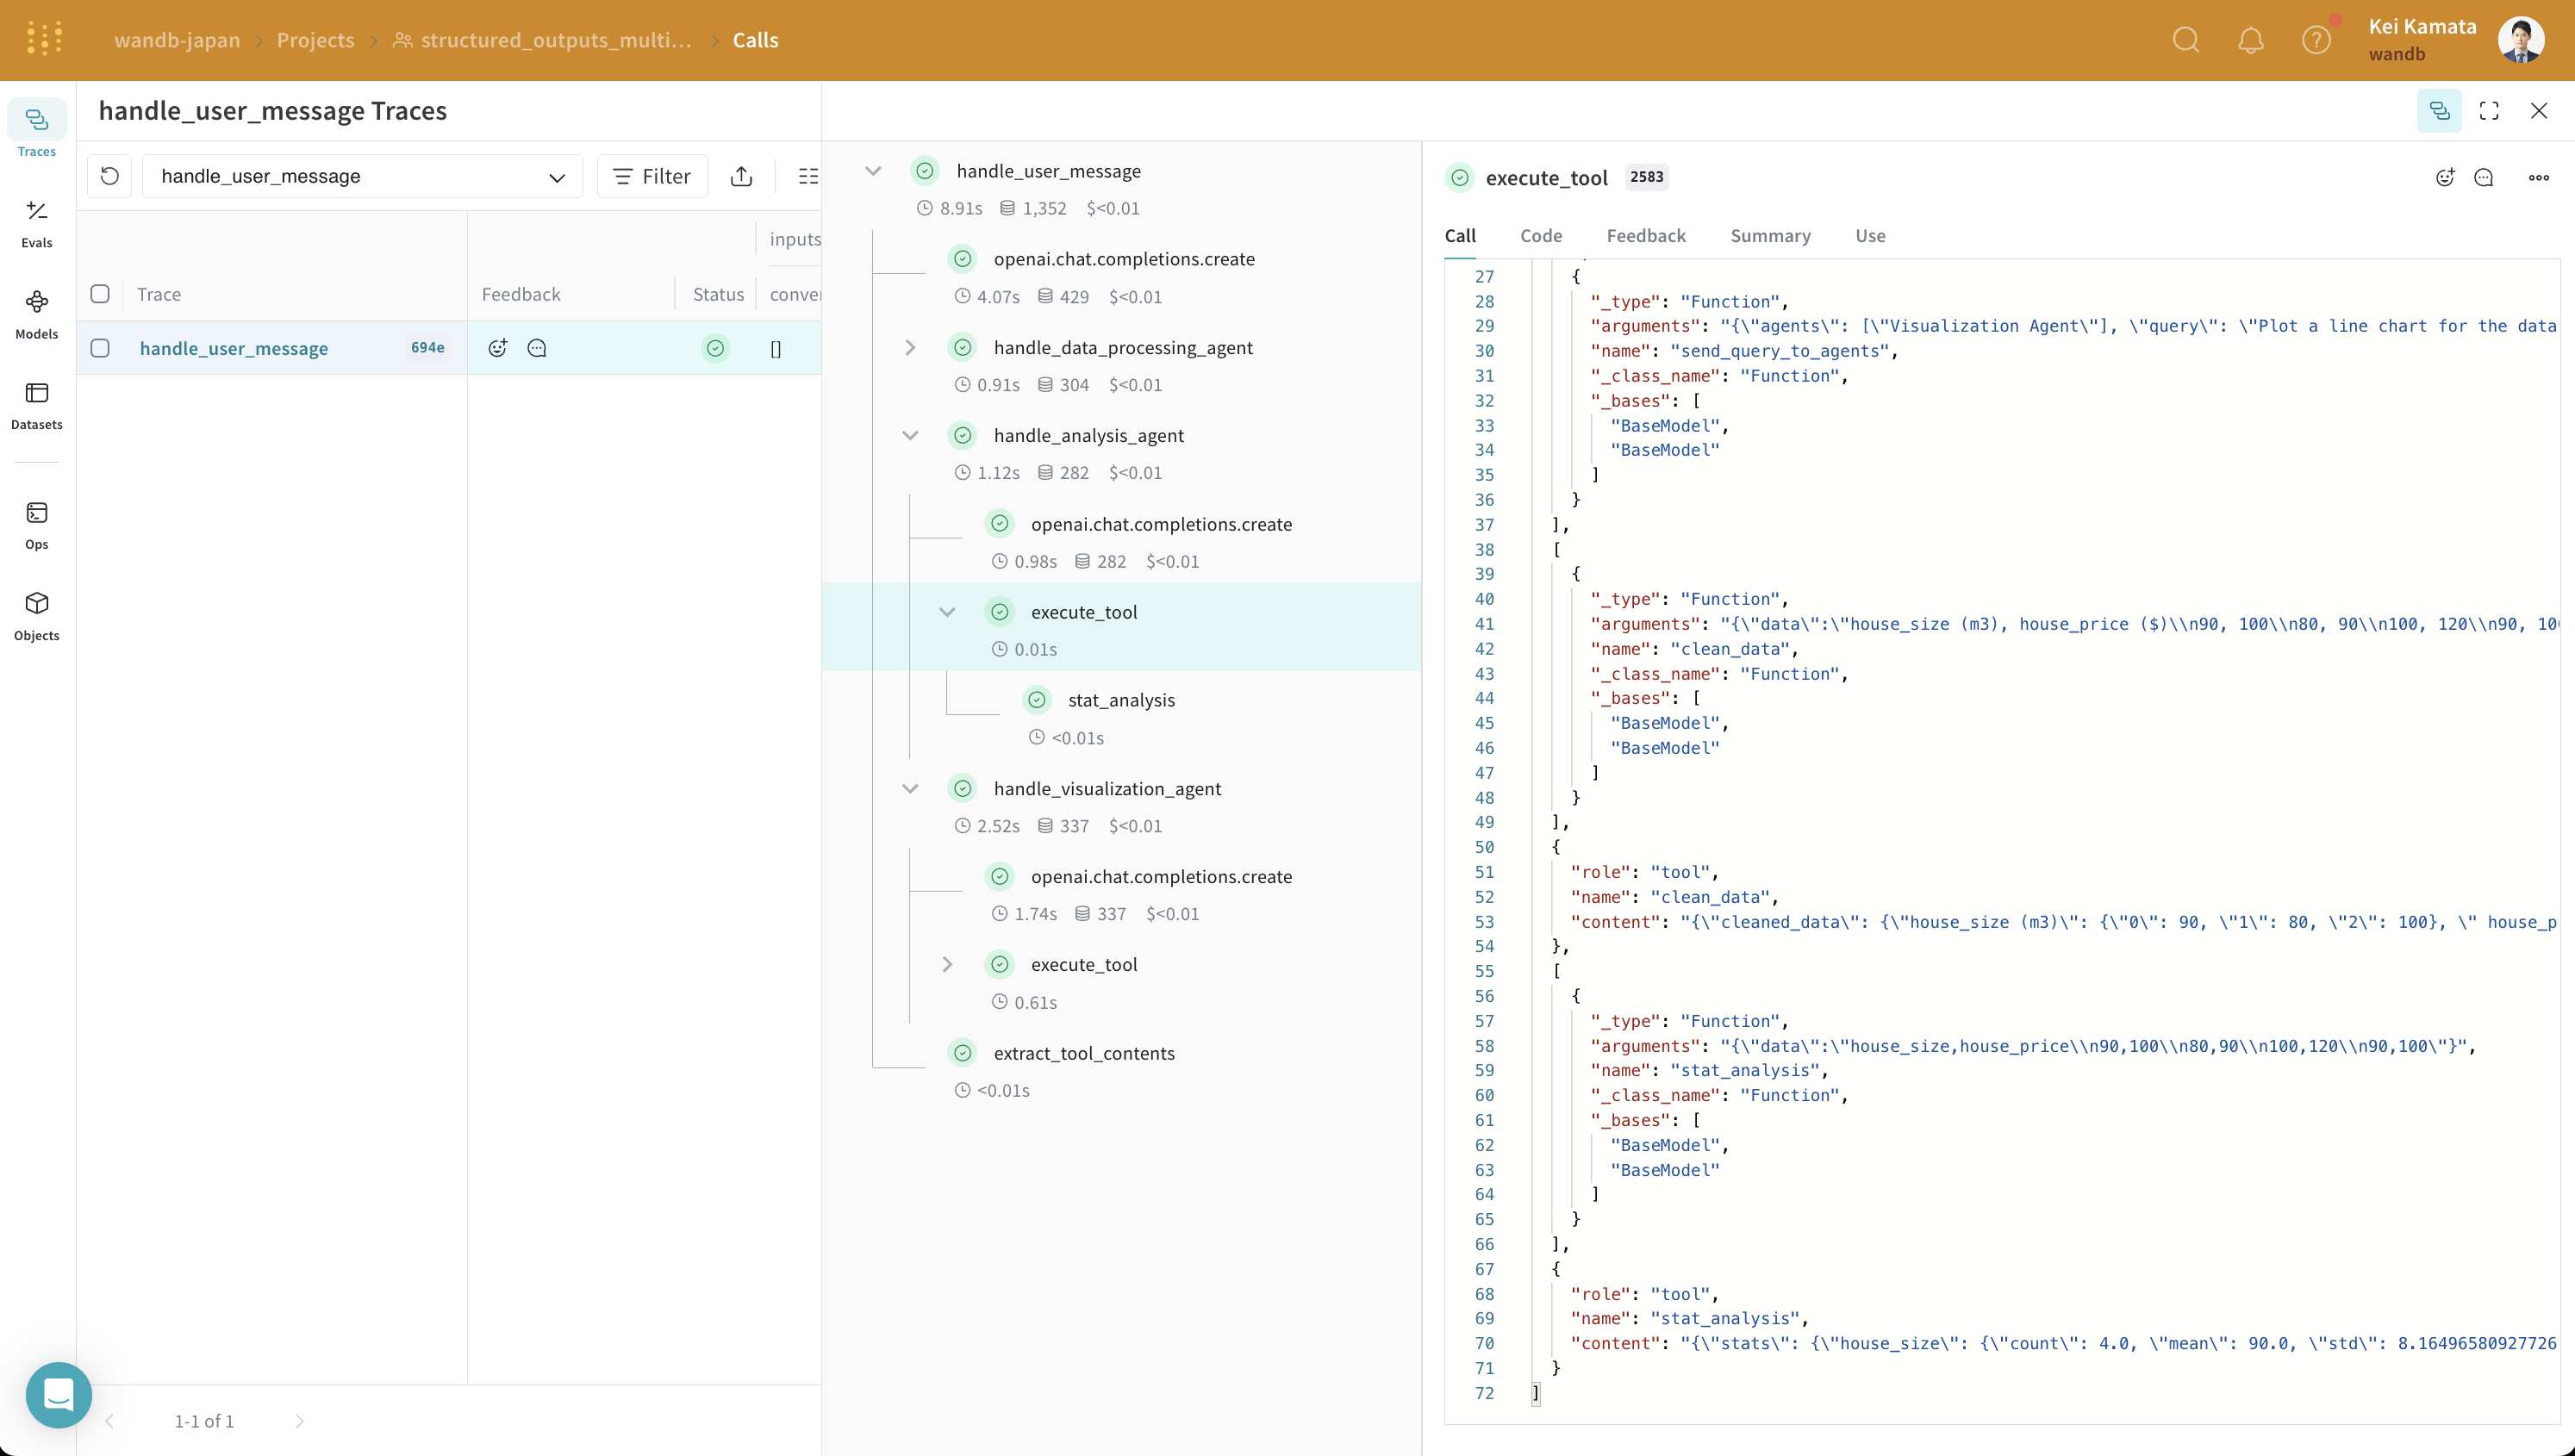
handle_user_message 関数を実行し、その結果を確認します。
不正なコードを報告
コピー
AIに質問
handle_user_message(user_query)
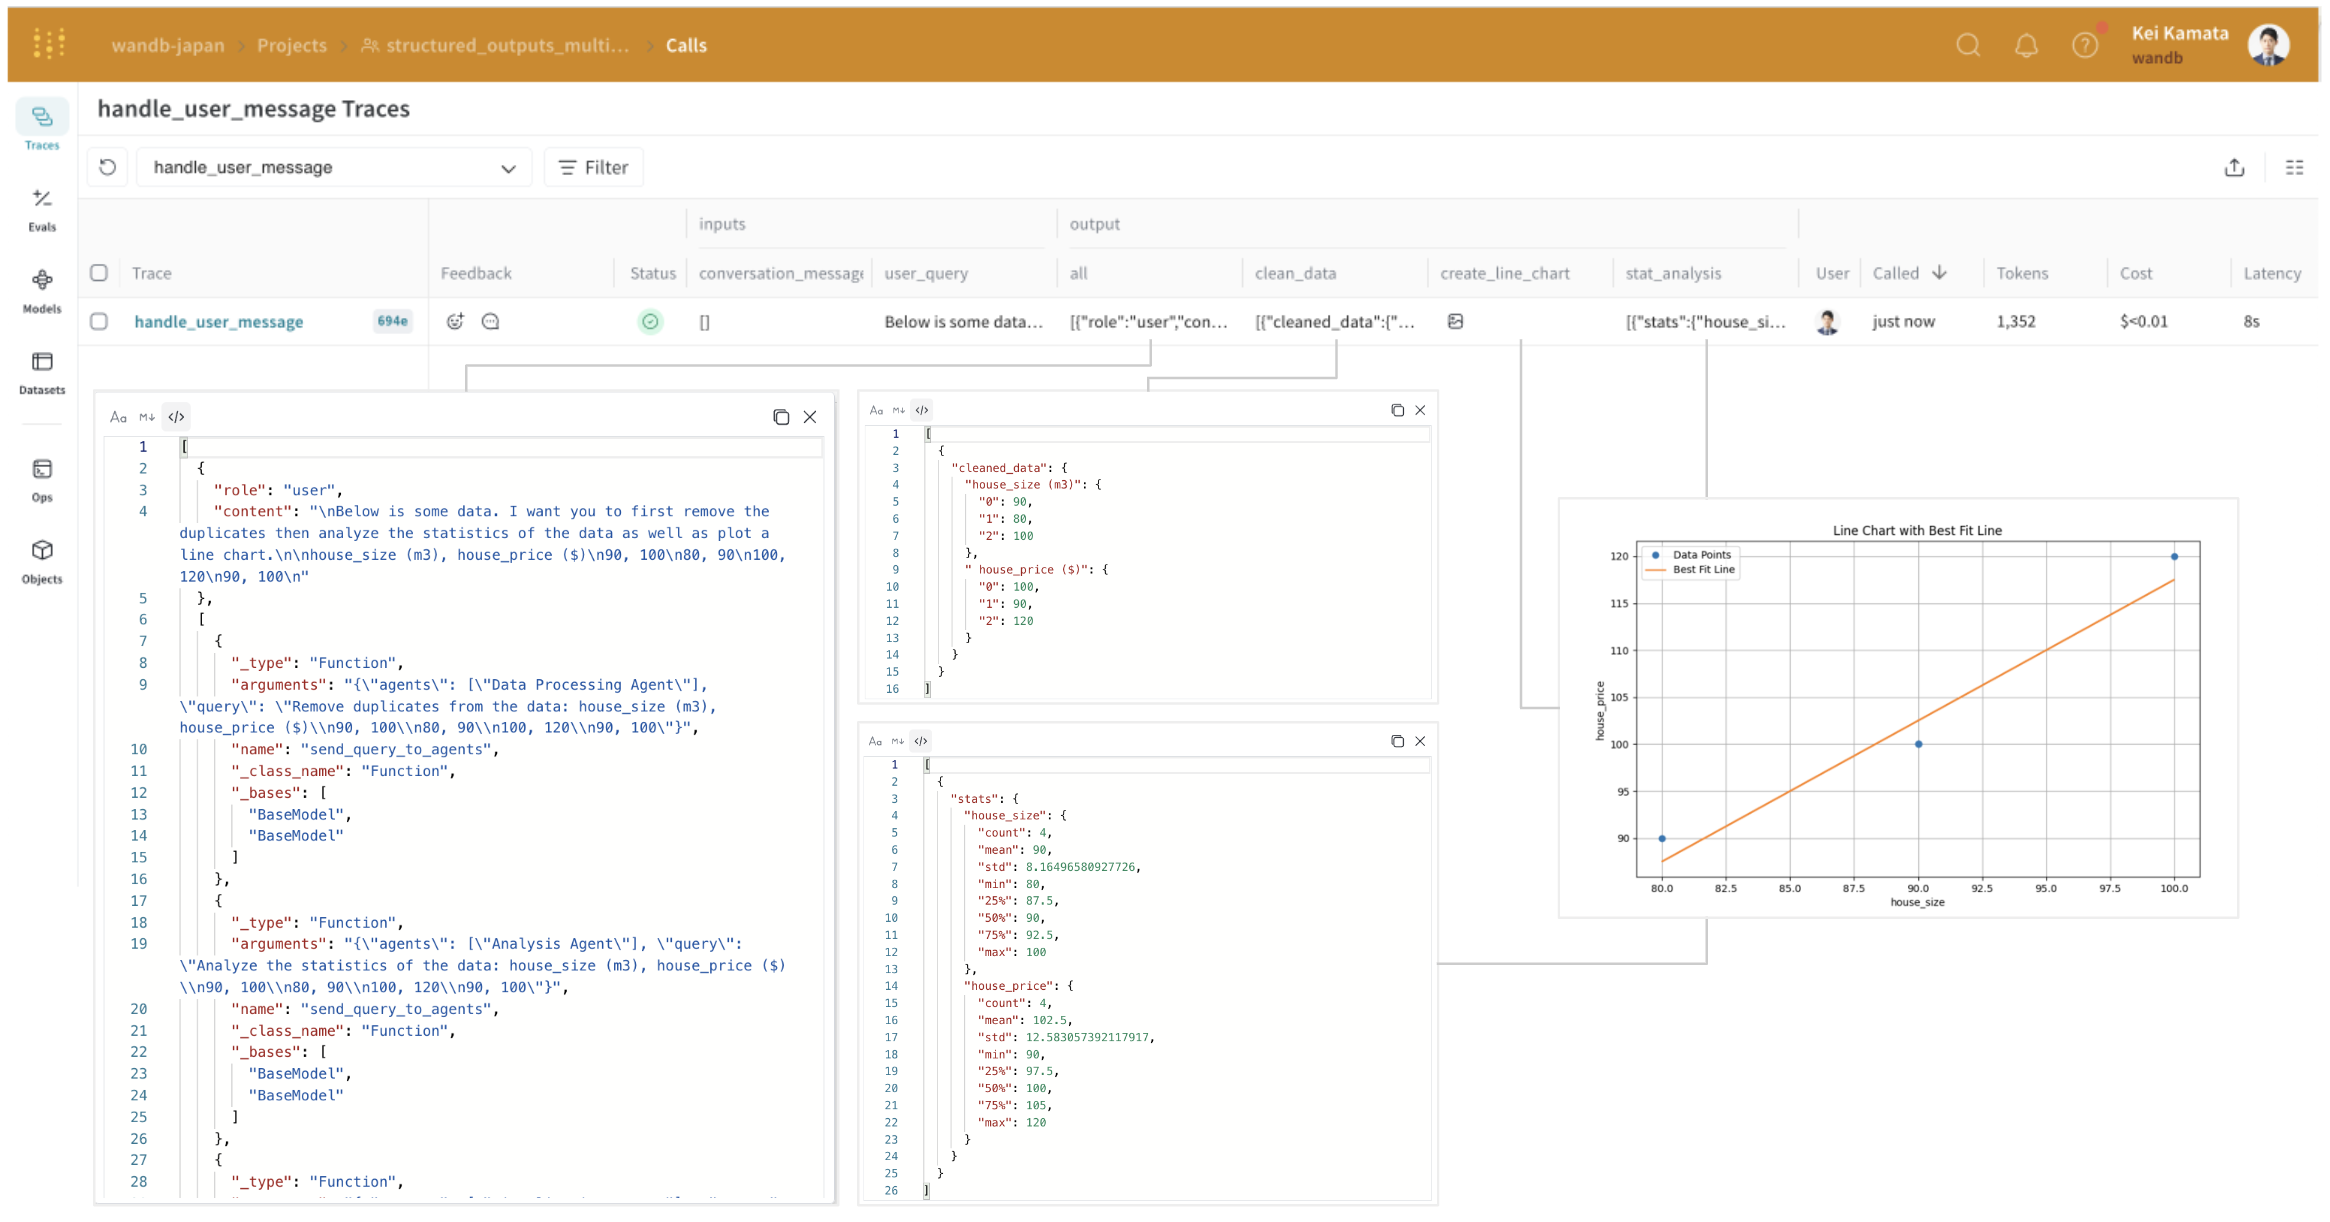
analysis_agent の入力と出力を見ることで、それが構造化出力形式になっていることがわかります。OpenAI の構造化出力は、エージェント間の連携を容易にしますが、システムが複雑になるにつれて、これらのやり取りがどのような形式で行われているのか把握しづらくなります。Weave を使うことで、これらの中間処理とその入出力を、まるで手に取るように理解できます。