이 노트북은 대화형입니다. 로컬에서 실행하거나 아래 링크를 사용할 수 있습니다:
다중 에이전트 시스템을 위한 구조화된 출력
strict: true를 사용하면, 응답이 제공된 스키마를 반드시 따르도록 보장할 수 있습니다.
다중 에이전트 시스템에서 구조화된 출력을 사용하면, 에이전트 간에 일관되고 처리하기 쉬운 데이터를 보장하여 통신을 향상시킵니다. 또한 명시적인 거절을 허용해 안전성을 개선하고, 재시도나 검증이 필요 없도록 하여 성능을 향상시킵니다. 이는 상호작용을 단순화하고 전체 시스템 효율성을 높입니다.
이 튜토리얼은 다중 에이전트 시스템에서 구조화된 출력을 활용하고, 이를 Weave로 추적하는 방법을 보여줍니다.
Source: 이 쿡북은 OpenAI의 구조화된 출력 샘플 코드를 기반으로 하며, Weave를 사용한 시각화를 개선하기 위해 일부 수정이 추가되었습니다.
필요한 의존성 설치
잘못된 코드 신고
복사
AI에게 묻기
!pip install -qU openai weave wandb
python
%%capture
# openai의 버그를 수정하기 위한 임시 해결 방법:
# TypeError: Client.__init__() got an unexpected keyword argument 'proxies'
# 참고: https://community.openai.com/t/error-with-openai-1-56-0-client-init-got-an-unexpected-keyword-argument-proxies/1040332/15
!pip install "httpx<0.28"
WANDB_API_KEY를 설정해 두면 wandb.login()으로 쉽게 로그인할 수 있습니다(이는 Colab에 secret으로 제공해야 합니다).
name_of_wandb_project에는 이 로그를 기록할 W&B의 프로젝트를 설정합니다.
NOTE: 트레이스를 기록할 팀을 지정하기 위해 name_of_wandb_project는 {team_name}/{project_name} 형식으로도 지정할 수 있습니다.
그다음 weave.init()을 호출해 Weave 클라이언트를 가져옵니다.
OpenAI API를 사용할 것이므로 OpenAI API 키도 필요합니다. OpenAI 플랫폼에서 가입하면 본인의 API 키를 받을 수 있습니다(이 역시 Colab에 secret으로 제공해야 합니다).
잘못된 코드 신고
복사
AI에게 묻기
import base64
import json
import os
from io import BytesIO, StringIO

import matplotlib.pyplot as plt
import numpy as np
import pandas as pd
import wandb
from google.colab import userdata
from openai import OpenAI

import weave
python
os.environ["WANDB_API_KEY"] = userdata.get("WANDB_API_KEY")
os.environ["OPENAI_API_KEY"] = userdata.get("OPENAI_API_KEY")

wandb.login()
name_of_wandb_project = "multi-agent-structured-output"
weave.init(name_of_wandb_project)

client = OpenAI()
MODEL = "gpt-4o-2024-08-06"
에이전트 설정
- 트리아지 에이전트: 어떤 에이전트를 호출할지 결정합니다
- 데이터 전처리 에이전트: 예를 들어 데이터를 정제해 분석에 적합한 형태로 준비합니다
- 데이터 분석 에이전트: 데이터에 대한 분석을 수행합니다
- Data Visualization 에이전트: 분석 결과를 시각화하여 인사이트를 도출합니다
잘못된 코드 신고
복사
AI에게 묻기
triaging_system_prompt = """You are a Triaging Agent. Your role is to assess the user's query and route it to the relevant agents. The agents available are:
- Data Processing Agent: Cleans, transforms, and aggregates data.
- Analysis Agent: Performs statistical, correlation, and regression analysis.
- Visualization Agent: Creates bar charts, line charts, and pie charts.

Use the send_query_to_agents tool to forward the user's query to the relevant agents. Also, use the speak_to_user tool to get more information from the user if needed."""

processing_system_prompt = """You are a Data Processing Agent. Your role is to clean, transform, and aggregate data using the following tools:
- clean_data
- transform_data
- aggregate_data"""

analysis_system_prompt = """You are an Analysis Agent. Your role is to perform statistical, correlation, and regression analysis using the following tools:
- stat_analysis
- correlation_analysis
- regression_analysis"""

visualization_system_prompt = """You are a Visualization Agent. Your role is to create bar charts, line charts, and pie charts using the following tools:
- create_bar_chart
- create_line_chart
- create_pie_chart"""
잘못된 코드 신고
복사
AI에게 묻기
triage_tools = [
    {
        "type": "function",
        "function": {
            "name": "send_query_to_agents",
            "description": "사용자 쿼리를 에이전트의 기능에 따라 관련 에이전트에게 전송합니다.",
            "parameters": {
                "type": "object",
                "properties": {
                    "agents": {
                        "type": "array",
                        "items": {"type": "string"},
                        "description": "쿼리를 전송할 에이전트 이름의 배열입니다.",
                    },
                    "query": {
                        "type": "string",
                        "description": "전송할 사용자 쿼리입니다.",
                    },
                },
                "required": ["agents", "query"],
            },
        },
        "strict": True,
    }
]

preprocess_tools = [
    {
        "type": "function",
        "function": {
            "name": "clean_data",
            "description": "중복을 제거하고 누락된 값을 처리하여 제공된 데이터를 정제합니다.",
            "parameters": {
                "type": "object",
                "properties": {
                    "data": {
                        "type": "string",
                        "description": "정제할 데이터셋입니다. JSON 또는 CSV와 같은 적절한 형식이어야 합니다.",
                    }
                },
                "required": ["data"],
                "additionalProperties": False,
            },
        },
        "strict": True,
    },
    {
        "type": "function",
        "function": {
            "name": "transform_data",
            "description": "지정된 규칙에 따라 데이터를 변환합니다.",
            "parameters": {
                "type": "object",
                "properties": {
                    "data": {
                        "type": "string",
                        "description": "변환할 데이터입니다. JSON 또는 CSV와 같은 적절한 형식이어야 합니다.",
                    },
                    "rules": {
                        "type": "string",
                        "description": "구조화된 형식으로 지정된 변환 규칙입니다.",
                    },
                },
                "required": ["data", "rules"],
                "additionalProperties": False,
            },
        },
        "strict": True,
    },
    {
        "type": "function",
        "function": {
            "name": "aggregate_data",
            "description": "지정된 열과 연산을 기준으로 데이터를 집계합니다.",
            "parameters": {
                "type": "object",
                "properties": {
                    "data": {
                        "type": "string",
                        "description": "집계할 데이터입니다. JSON 또는 CSV와 같은 적절한 형식이어야 합니다.",
                    },
                    "group_by": {
                        "type": "array",
                        "items": {"type": "string"},
                        "description": "그룹화 기준 열입니다.",
                    },
                    "operations": {
                        "type": "string",
                        "description": "구조화된 형식으로 지정된 집계 연산입니다.",
                    },
                },
                "required": ["data", "group_by", "operations"],
                "additionalProperties": False,
            },
        },
        "strict": True,
    },
]

analysis_tools = [
    {
        "type": "function",
        "function": {
            "name": "stat_analysis",
            "description": "주어진 데이터셋에 대해 통계 분석을 수행합니다.",
            "parameters": {
                "type": "object",
                "properties": {
                    "data": {
                        "type": "string",
                        "description": "분석할 데이터셋입니다. JSON 또는 CSV와 같은 적절한 형식이어야 합니다.",
                    }
                },
                "required": ["data"],
                "additionalProperties": False,
            },
        },
        "strict": True,
    },
    {
        "type": "function",
        "function": {
            "name": "correlation_analysis",
            "description": "데이터셋의 변수 간 상관 계수를 계산합니다.",
            "parameters": {
                "type": "object",
                "properties": {
                    "data": {
                        "type": "string",
                        "description": "분석할 데이터셋입니다. JSON 또는 CSV와 같은 적절한 형식이어야 합니다.",
                    },
                    "variables": {
                        "type": "array",
                        "items": {"type": "string"},
                        "description": "상관관계를 계산할 변수 목록입니다.",
                    },
                },
                "required": ["data", "variables"],
                "additionalProperties": False,
            },
        },
        "strict": True,
    },
    {
        "type": "function",
        "function": {
            "name": "regression_analysis",
            "description": "데이터셋에 대해 회귀 분석을 수행합니다.",
            "parameters": {
                "type": "object",
                "properties": {
                    "data": {
                        "type": "string",
                        "description": "분석할 데이터셋입니다. JSON 또는 CSV와 같은 적절한 형식이어야 합니다.",
                    },
                    "dependent_var": {
                        "type": "string",
                        "description": "회귀 분석의 종속 변수입니다.",
                    },
                    "independent_vars": {
                        "type": "array",
                        "items": {"type": "string"},
                        "description": "독립 변수 목록입니다.",
                    },
                },
                "required": ["data", "dependent_var", "independent_vars"],
                "additionalProperties": False,
            },
        },
        "strict": True,
    },
]

visualization_tools = [
    {
        "type": "function",
        "function": {
            "name": "create_bar_chart",
            "description": "제공된 데이터로 막대 차트를 생성합니다.",
            "parameters": {
                "type": "object",
                "properties": {
                    "data": {
                        "type": "string",
                        "description": "막대 차트에 사용할 데이터입니다. JSON 또는 CSV와 같은 적절한 형식이어야 합니다.",
                    },
                    "x": {"type": "string", "description": "x축 열입니다."},
                    "y": {"type": "string", "description": "y축 열입니다."},
                },
                "required": ["data", "x", "y"],
                "additionalProperties": False,
            },
        },
        "strict": True,
    },
    {
        "type": "function",
        "function": {
            "name": "create_line_chart",
            "description": "제공된 데이터로 선 차트를 생성합니다.",
            "parameters": {
                "type": "object",
                "properties": {
                    "data": {
                        "type": "string",
                        "description": "선 차트에 사용할 데이터입니다. JSON 또는 CSV와 같은 적절한 형식이어야 합니다.",
                    },
                    "x": {"type": "string", "description": "x축 열입니다."},
                    "y": {"type": "string", "description": "y축 열입니다."},
                },
                "required": ["data", "x", "y"],
                "additionalProperties": False,
            },
        },
        "strict": True,
    },
    {
        "type": "function",
        "function": {
            "name": "create_pie_chart",
            "description": "제공된 데이터로 파이 차트를 생성합니다.",
            "parameters": {
                "type": "object",
                "properties": {
                    "data": {
                        "type": "string",
                        "description": "파이 차트에 사용할 데이터입니다. JSON 또는 CSV와 같은 적절한 형식이어야 합니다.",
                    },
                    "labels": {
                        "type": "string",
                        "description": "레이블 열입니다.",
                    },
                    "values": {
                        "type": "string",
                        "description": "값 열입니다.",
                    },
                },
                "required": ["data", "labels", "values"],
                "additionalProperties": False,
            },
        },
        "strict": True,
    },
]
Weave를 사용하여 멀티 에이전트 추적 활성화
- 사용자 쿼리를 멀티 에이전트 시스템에 전달
- 멀티 에이전트 시스템의 내부 동작 처리
- 도구 호출 실행
잘못된 코드 신고
복사
AI에게 묻기
# 예시 쿼리

user_query = """
Below is some data. I want you to first remove the duplicates then analyze the statistics of the data as well as plot a line chart.

house_size (m3), house_price ($)
90, 100
80, 90
100, 120
90, 100
"""
clean_data, start_analysis, use_line_chart임을 알 수 있습니다.
도구 호출 실행을 담당하는 함수를 정의하는 것부터 시작하겠습니다.
Python 함수에 @weave.op() 데코레이터를 추가하면, 언어 모델의 입력, 출력, 그리고 트레이스를 로깅하고 디버깅할 수 있습니다.
멀티 에이전트 시스템을 만들 때는 많은 함수가 정의되지만, 그 위에 @weave.op()만 간단히 추가해 주면 충분합니다.
잘못된 코드 신고
복사
AI에게 묻기
@weave.op()
def clean_data(data):
    data_io = StringIO(data)
    df = pd.read_csv(data_io, sep=",")
    df_deduplicated = df.drop_duplicates()
    return df_deduplicated

@weave.op()
def stat_analysis(data):
    data_io = StringIO(data)
    df = pd.read_csv(data_io, sep=",")
    return df.describe()

@weave.op()
def plot_line_chart(data):
    data_io = StringIO(data)
    df = pd.read_csv(data_io, sep=",")

    x = df.iloc[:, 0]
    y = df.iloc[:, 1]

    coefficients = np.polyfit(x, y, 1)
    polynomial = np.poly1d(coefficients)
    y_fit = polynomial(x)

    plt.figure(figsize=(10, 6))
    plt.plot(x, y, "o", label="Data Points")
    plt.plot(x, y_fit, "-", label="Best Fit Line")
    plt.title("Line Chart with Best Fit Line")
    plt.xlabel(df.columns[0])
    plt.ylabel(df.columns[1])
    plt.legend()
    plt.grid(True)

    # 표시하기 전에 플롯을 BytesIO 버퍼에 저장
    buf = BytesIO()
    plt.savefig(buf, format="png")
    buf.seek(0)

    # 플롯 표시
    plt.show()

    # 데이터 URL을 위해 이미지를 base64로 인코딩
    image_data = buf.getvalue()
    base64_encoded_data = base64.b64encode(image_data)
    base64_string = base64_encoded_data.decode("utf-8")
    data_url = f"data:image/png;base64,{base64_string}"

    return data_url

# 도구를 실행하는 함수 정의
@weave.op()
def execute_tool(tool_calls, messages):
    for tool_call in tool_calls:
        tool_name = tool_call.function.name
        tool_arguments = json.loads(tool_call.function.arguments)

        if tool_name == "clean_data":
            # 데이터 정제 시뮬레이션
            cleaned_df = clean_data(tool_arguments["data"])
            cleaned_data = {"cleaned_data": cleaned_df.to_dict()}
            messages.append(
                {"role": "tool", "name": tool_name, "content": json.dumps(cleaned_data)}
            )
            print("Cleaned data: ", cleaned_df)
        elif tool_name == "transform_data":
            # 데이터 변환 시뮬레이션
            transformed_data = {"transformed_data": "sample_transformed_data"}
            messages.append(
                {
                    "role": "tool",
                    "name": tool_name,
                    "content": json.dumps(transformed_data),
                }
            )
        elif tool_name == "aggregate_data":
            # 데이터 집계 시뮬레이션
            aggregated_data = {"aggregated_data": "sample_aggregated_data"}
            messages.append(
                {
                    "role": "tool",
                    "name": tool_name,
                    "content": json.dumps(aggregated_data),
                }
            )
        elif tool_name == "stat_analysis":
            # 통계 분석 시뮬레이션
            stats_df = stat_analysis(tool_arguments["data"])
            stats = {"stats": stats_df.to_dict()}
            messages.append(
                {"role": "tool", "name": tool_name, "content": json.dumps(stats)}
            )
            print("Statistical Analysis: ", stats_df)
        elif tool_name == "correlation_analysis":
            # 상관 분석 시뮬레이션
            correlations = {"correlations": "sample_correlations"}
            messages.append(
                {"role": "tool", "name": tool_name, "content": json.dumps(correlations)}
            )
        elif tool_name == "regression_analysis":
            # 회귀 분석 시뮬레이션
            regression_results = {"regression_results": "sample_regression_results"}
            messages.append(
                {
                    "role": "tool",
                    "name": tool_name,
                    "content": json.dumps(regression_results),
                }
            )
        elif tool_name == "create_bar_chart":
            # 막대 차트 생성 시뮬레이션
            bar_chart = {"bar_chart": "sample_bar_chart"}
            messages.append(
                {"role": "tool", "name": tool_name, "content": json.dumps(bar_chart)}
            )
        elif tool_name == "create_line_chart":
            # 선 차트 생성 시뮬레이션
            line_chart = {"line_chart": plot_line_chart(tool_arguments["data"])}
            messages.append(
                {"role": "tool", "name": tool_name, "content": json.dumps(line_chart)}
            )
        elif tool_name == "create_pie_chart":
            # 파이 차트 생성 시뮬레이션
            pie_chart = {"pie_chart": "sample_pie_chart"}
            messages.append(
                {"role": "tool", "name": tool_name, "content": json.dumps(pie_chart)}
            )
    return messages
잘못된 코드 신고
복사
AI에게 묻기
# 각 에이전트의 처리를 담당하는 함수 정의
@weave.op()
def handle_data_processing_agent(query, conversation_messages):
    messages = [{"role": "system", "content": processing_system_prompt}]
    messages.append({"role": "user", "content": query})

    response = client.chat.completions.create(
        model=MODEL,
        messages=messages,
        temperature=0,
        tools=preprocess_tools,
    )

    conversation_messages.append(
        [tool_call.function for tool_call in response.choices[0].message.tool_calls]
    )
    execute_tool(response.choices[0].message.tool_calls, conversation_messages)

@weave.op()
def handle_analysis_agent(query, conversation_messages):
    messages = [{"role": "system", "content": analysis_system_prompt}]
    messages.append({"role": "user", "content": query})

    response = client.chat.completions.create(
        model=MODEL,
        messages=messages,
        temperature=0,
        tools=analysis_tools,
    )

    conversation_messages.append(
        [tool_call.function for tool_call in response.choices[0].message.tool_calls]
    )
    execute_tool(response.choices[0].message.tool_calls, conversation_messages)

@weave.op()
def handle_visualization_agent(query, conversation_messages):
    messages = [{"role": "system", "content": visualization_system_prompt}]
    messages.append({"role": "user", "content": query})

    response = client.chat.completions.create(
        model=MODEL,
        messages=messages,
        temperature=0,
        tools=visualization_tools,
    )

    conversation_messages.append(
        [tool_call.function for tool_call in response.choices[0].message.tool_calls]
    )
    execute_tool(response.choices[0].message.tool_calls, conversation_messages)
잘못된 코드 신고
복사
AI에게 묻기
# 사용자 입력 및 트리아지 처리 함수
@weave.op()
def handle_user_message(user_query, conversation_messages=None):
    if conversation_messages is None:
        conversation_messages = []
    user_message = {"role": "user", "content": user_query}
    conversation_messages.append(user_message)

    messages = [{"role": "system", "content": triaging_system_prompt}]
    messages.extend(conversation_messages)

    response = client.chat.completions.create(
        model=MODEL,
        messages=messages,
        temperature=0,
        tools=triage_tools,
    )

    conversation_messages.append(
        [tool_call.function for tool_call in response.choices[0].message.tool_calls]
    )

    for tool_call in response.choices[0].message.tool_calls:
        if tool_call.function.name == "send_query_to_agents":
            agents = json.loads(tool_call.function.arguments)["agents"]
            query = json.loads(tool_call.function.arguments)["query"]
            for agent in agents:
                if agent == "Data Processing Agent":
                    handle_data_processing_agent(query, conversation_messages)
                elif agent == "Analysis Agent":
                    handle_analysis_agent(query, conversation_messages)
                elif agent == "Visualization Agent":
                    handle_visualization_agent(query, conversation_messages)

    outputs = extract_tool_contents(conversation_messages)

    return outputs

functions = [
    "clean_data",
    "transform_data",
    "stat_analysis",
    "aggregate_data",
    "correlation_analysis",
    "regression_analysis",
    "create_bar_chart",
    "create_line_chart",
    "create_pie_chart",
]

@weave.op()
def extract_tool_contents(data):
    contents = {}
    contents["all"] = data
    for element in data:
        if (
            isinstance(element, dict)
            and element.get("role") == "tool"
            and element.get("name") in functions
        ):
            name = element["name"]
            content_str = element["content"]
            try:
                content_json = json.loads(content_str)
                if "chart" not in element.get("name"):
                    contents[name] = [content_json]
                else:
                    first_key = next(iter(content_json))
                    second_level = content_json[first_key]
                    if isinstance(second_level, dict):
                        second_key = next(iter(second_level))
                        contents[name] = second_level[second_key]
                    else:
                        contents[name] = second_level
            except json.JSONDecodeError:
                print(f"{name}의 JSON 디코딩 오류")
                contents[name] = None

    return contents
Weave에서 멀티 에이전트 시스템 실행 및 시각화
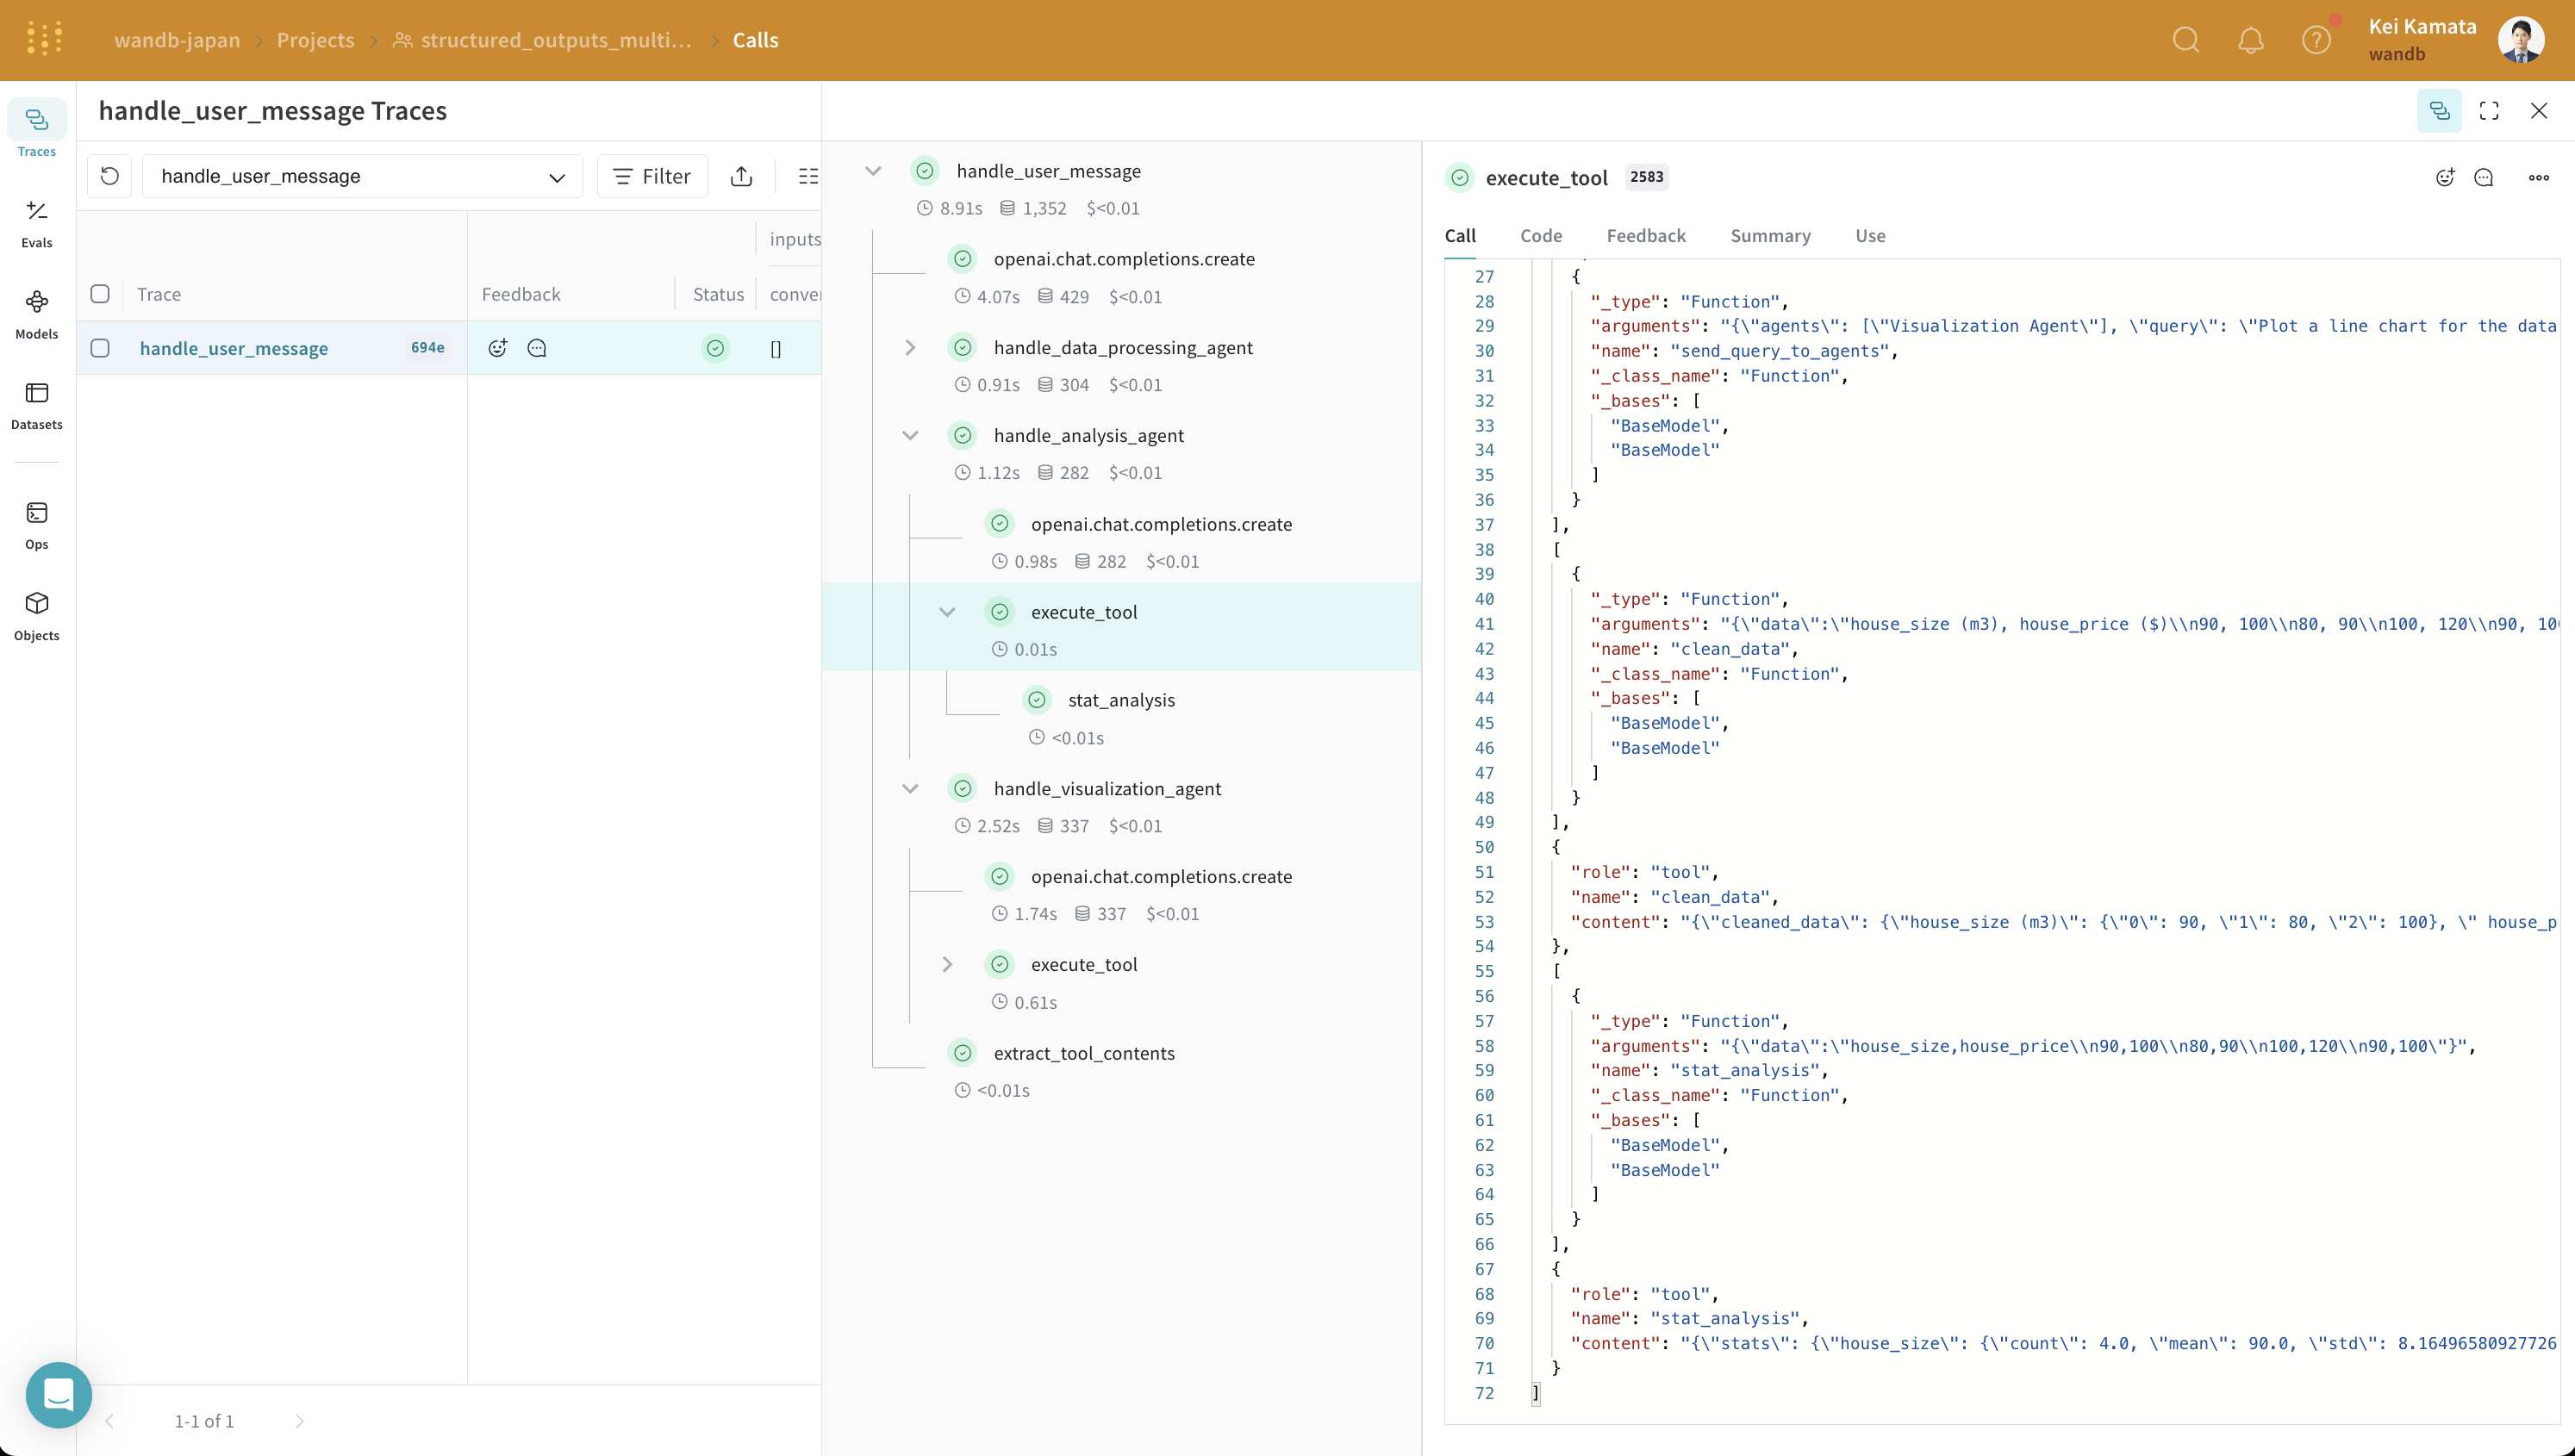
handle_user_message 함수를 실행하고 결과를 확인합니다.
잘못된 코드 신고
복사
AI에게 묻기
handle_user_message(user_query)
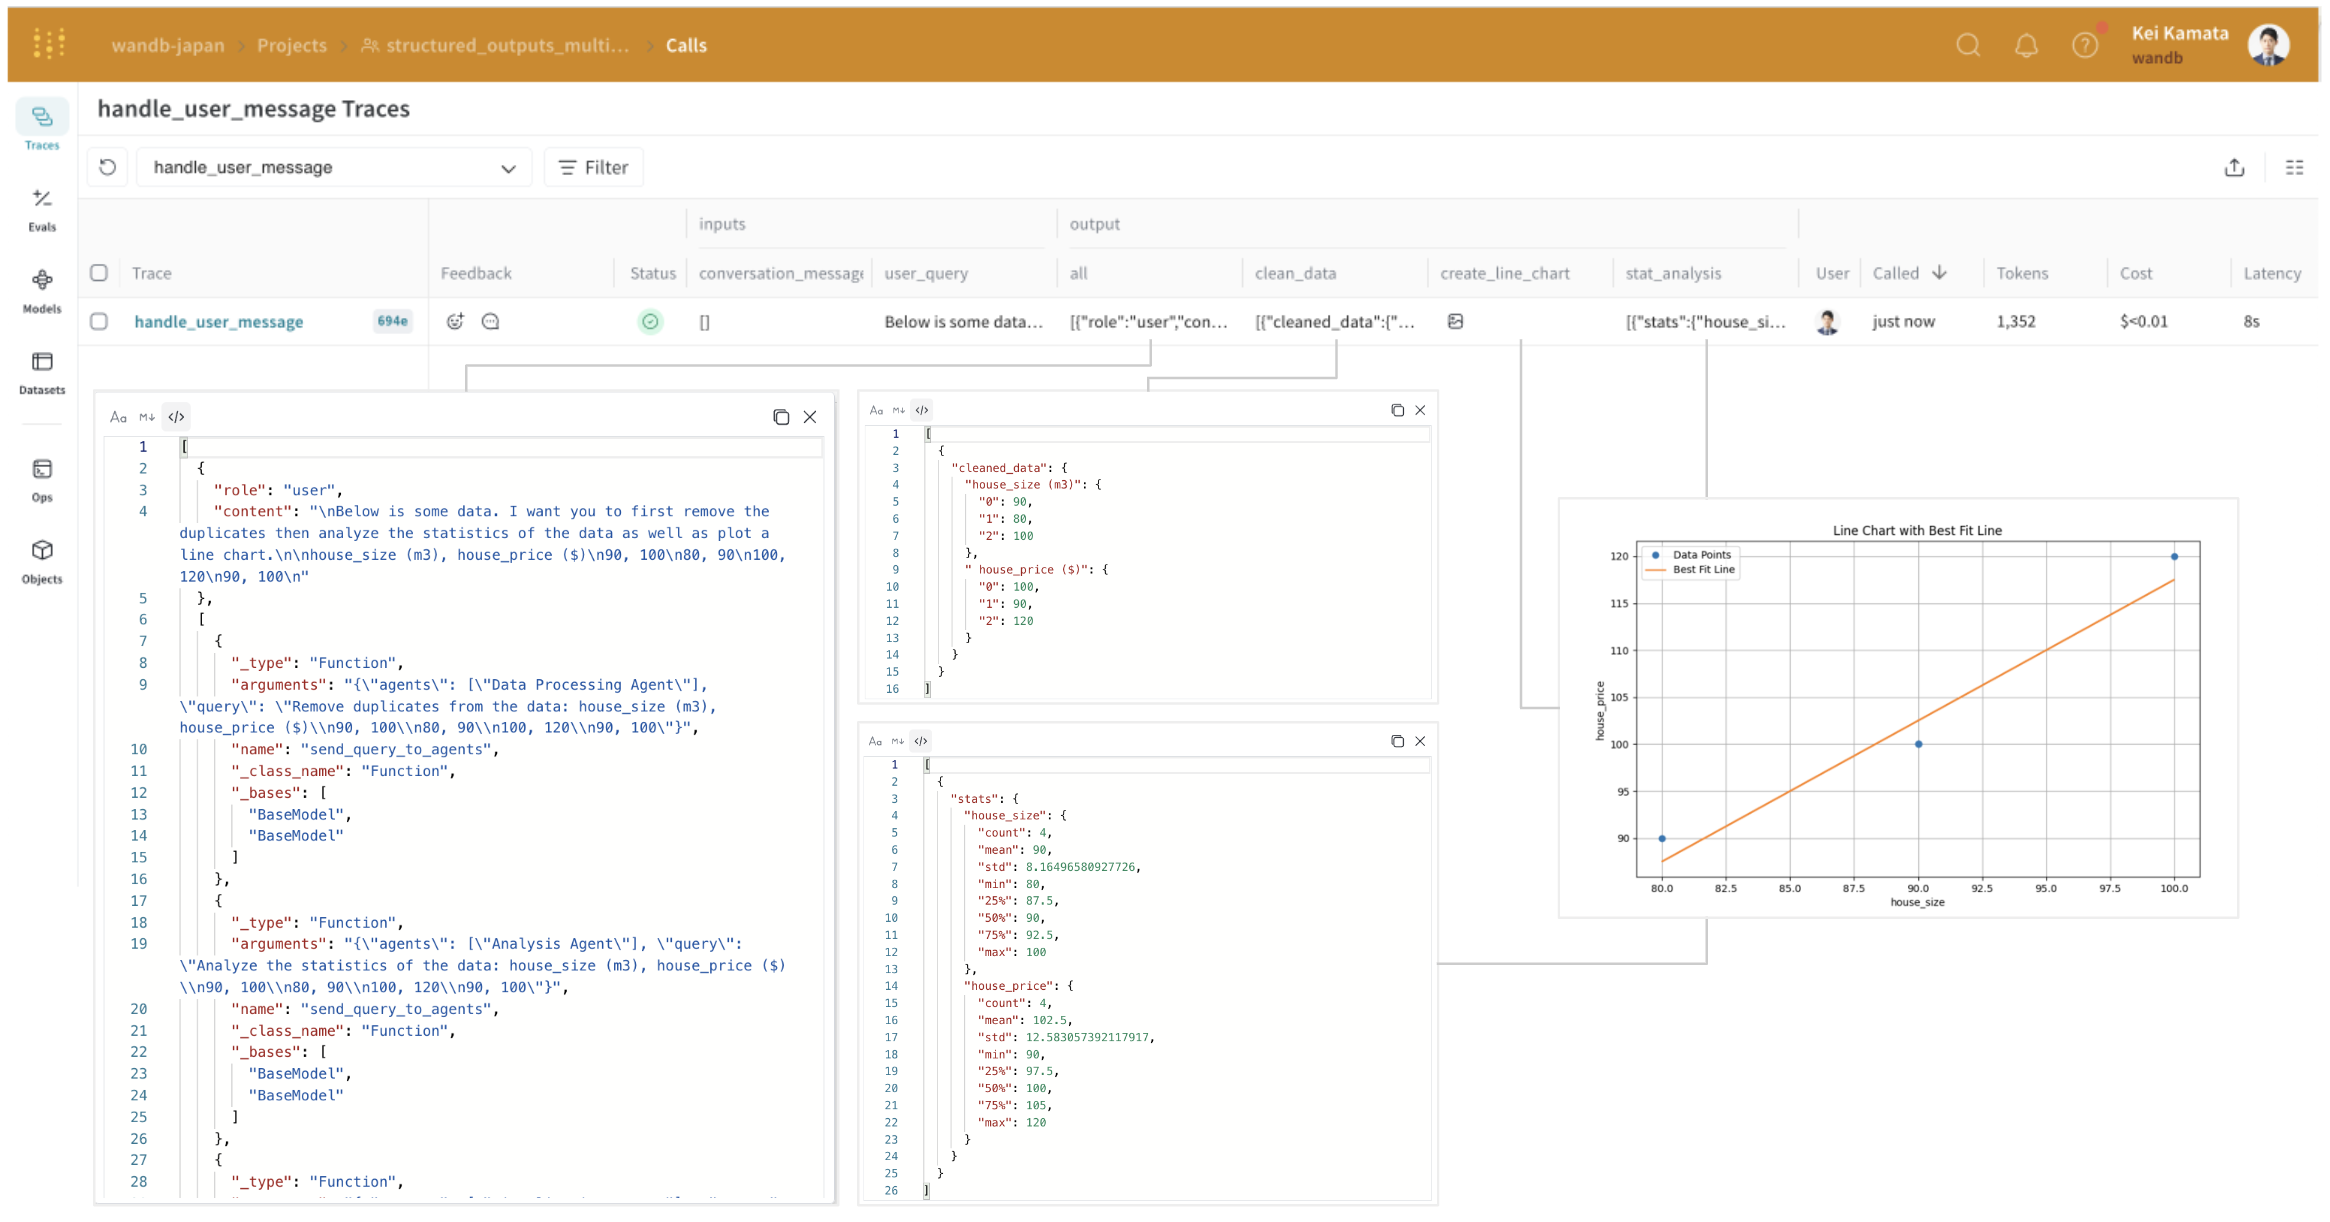
analysis_agent의 입력과 출력을 살펴보면, 구조화된 출력 포맷을 사용하고 있음을 알 수 있습니다. OpenAI의 구조화된 출력은 에이전트 간 협업을 용이하게 하지만, 시스템이 복잡해질수록 이러한 상호작용이 어떤 포맷으로 이루어지는지 파악하기 어려워집니다. Weave를 사용하면 이러한 중간 프로세스와 그 입력 및 출력을 마치 손에 들고 보듯이 명확하게 이해할 수 있습니다.